The Dark Knight wrote:As Beef as pointed out you've definitely missed us. Brilliant analyzing though mate.
You are there, but you're under the Pt Districts dot - there are actually two dots there which is why it missed my QA!
This happened a couple of times, in that there were two locations for the one club on the SAAFL website - I think if juniors or other teams play at different grounds - SHOC for example. It was usually obvious which location was the one for the A Grade but for you guys I missed it.
It would make a very, very minor difference to the overall pattern though.
Mr Beefy wrote:I think it must districts missing only 9 data points for div 1 on the latest chart but then again uni is excluded
No, they're both there, just at the same point. Div 1 has 9 because as you correctly put it, Adelaide Uni were removed.
Pag wrote:Awesome work morell, think you missed Salisbury West and North Pines too mate but a top effort. Definitely an interesting look.
Nope, theyre both there, under the big Salisbury label. You can see their catchments in the third map.
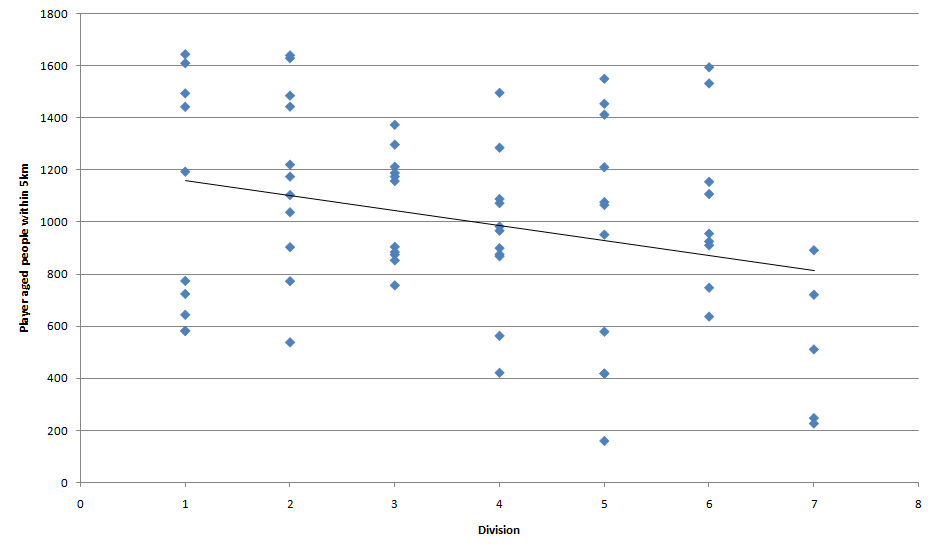
Jetters wrote:Looking at the data div 7 as a group appears to be an outlier, is there any correlation if you removed it?
-0.14. Still a pattern, but much less so, and perhaps not statistically significant.
But that is besides the point, you cannot remove entire sections of your sample size like that, it defeats the purpose of the analysis. Perhaps its just that the teams in D7 are there at least partly because of the lack of local playing age stock.
jo172 wrote:It would also be interesting to see it without the Old Colls sides as in some cases their Oval is no where near their school (Old Iggies). Also, the "catchment" for elite colleges such as PAC and SPOC is more a matter of family blood allegiance rather than geographical catchment.
Agree and I might just do that!
And thanks for the positive feedback guys!